Monday, July 26, 2010
Tuesday, July 20, 2010
Saturday, July 10, 2010
iftop to monitor traffic/bandwidth in SUSE/openSUSE
iftop is yet another free opensource tool to measure bandwidth utilization on the network interfaces on your systems or servers. As the name predicts, iftop is what “top” utility is for CPU usage measurement.
iftop can also run in promiscous mode and listen for all traffic on the subnet and can also listen for traffic on specified networks. iftop can be run in custom modes like disabling DNS name lookups, converting ports to service names, displaying results in Bytes etc.
For a detailed list of options run iftop with a “-h” arguement as follows:
opensuse11:~ # iftop -h
iftop: display bandwidth usage on an interface by host
Synopsis: iftop -h | [-npbBP] [-i interface] [-f filter code] [-N net/mask]
-h display this message
-n don’t do hostname lookups
-N don’t convert port numbers to services
-p run in promiscuous mode (show traffic between other
hosts on the same network segment)
-b don’t display a bar graph of traffic
-B Display bandwidth in bytes
-i interface listen on named interface
-f filter code use filter code to select packets to count
(default: none, but only IP packets are counted)
-F net/mask show traffic flows in/out of network
-P show ports as well as hosts
-m limit sets the upper limit for the bandwidth scale
-c config file specifies an alternative configuration file
iftop, version 0.17
copyright (c) 2002 Paul Warren and contributors
Install IFTOP in openSUSE
Click from the 1-click installer for your openSUSE build to download the YMP file and launch an autmatic installation process which should add the required repositories and download and install the required packages and dependencies.
Once the installation finishes succesfully, iftop should be installed under /usr/sbin
opensuse11:~ # which iftop
/usr/sbin/iftop
To have a quick preview of the bandwidth utilization, simply run “iftop” without any arguements:
opensuse11:~ # iftop
iftop1
To run in a promiscous mode and listen for all traffic on the subnet, run with “-p” option
opensuse11:~ # iftop -p
iftop2
As shown earlier, use “-h” arguement for all options.
Click here to visit the project home.
Related posts
* 1-click installs for Nagios Addons & plugins in openSUSE 11.0 (3)
* 1-click installs for Nagios in openSUSE 11.1 (0)
* abby GUI & addons utilities for Clive/CClive (1)
* AbiWord – Free opensource Word Processor for openSUSE Linux (2)
* Acetoneiso2 – A full feature rich Image/ISO tool for openSUSE (6)
iftop can also run in promiscous mode and listen for all traffic on the subnet and can also listen for traffic on specified networks. iftop can be run in custom modes like disabling DNS name lookups, converting ports to service names, displaying results in Bytes etc.
For a detailed list of options run iftop with a “-h” arguement as follows:
opensuse11:~ # iftop -h
iftop: display bandwidth usage on an interface by host
Synopsis: iftop -h | [-npbBP] [-i interface] [-f filter code] [-N net/mask]
-h display this message
-n don’t do hostname lookups
-N don’t convert port numbers to services
-p run in promiscuous mode (show traffic between other
hosts on the same network segment)
-b don’t display a bar graph of traffic
-B Display bandwidth in bytes
-i interface listen on named interface
-f filter code use filter code to select packets to count
(default: none, but only IP packets are counted)
-F net/mask show traffic flows in/out of network
-P show ports as well as hosts
-m limit sets the upper limit for the bandwidth scale
-c config file specifies an alternative configuration file
iftop, version 0.17
copyright (c) 2002 Paul Warren
Install IFTOP in openSUSE
Click from the 1-click installer for your openSUSE build to download the YMP file and launch an autmatic installation process which should add the required repositories and download and install the required packages and dependencies.
Once the installation finishes succesfully, iftop should be installed under /usr/sbin
opensuse11:~ # which iftop
/usr/sbin/iftop
To have a quick preview of the bandwidth utilization, simply run “iftop” without any arguements:
opensuse11:~ # iftop
iftop1
To run in a promiscous mode and listen for all traffic on the subnet, run with “-p” option
opensuse11:~ # iftop -p
iftop2
As shown earlier, use “-h” arguement for all options.
Click here to visit the project home.
Related posts
* 1-click installs for Nagios Addons & plugins in openSUSE 11.0 (3)
* 1-click installs for Nagios in openSUSE 11.1 (0)
* abby GUI & addons utilities for Clive/CClive (1)
* AbiWord – Free opensource Word Processor for openSUSE Linux (2)
* Acetoneiso2 – A full feature rich Image/ISO tool for openSUSE (6)
SUSE Linux Tips
Network Monitoring Through Nagios
Create an Admin user for nagios
opensuse11:~ # htpasswd2 -c /etc/nagios/htpasswd.users nagiosadmin
This creates a new htpasswd.user file (-c option) and installs nagiosadmin as a new user for nagios web interface. Any later user account should be added without the “-c” option as follows to avoid the risk of overwriting the htpasswd.users file
opensuse11:~ # htpasswd2 /etc/nagios/htpasswd.users nagiosuser
Thats the web interface sorted.
Make Nagios Start at system startup
Add Nagios to the list of services on the system and make it start automatically at the system start/restart as follows:
opensuse11:~ # chkconfig nagios
opensuse11:~ # chkconfig nagios on
We are nearly there to get Nagios up and running.
Restart Apache
Restart Apache2 webserver to enable the Nagios web interface
opensuse11:~ # rcapache2 restart
Start Nagios
The installation adds a configuration file for the localhost as /etc/nagios/objects/localhost.cfg. This checks the network status, system load, system users, HTTP, PING, Root partition, SSH, Swap and total processes running on the system. This gives us a quick look into Nagios before we go on and add additional systems and services.
opensuse11:~ # rcnagios start

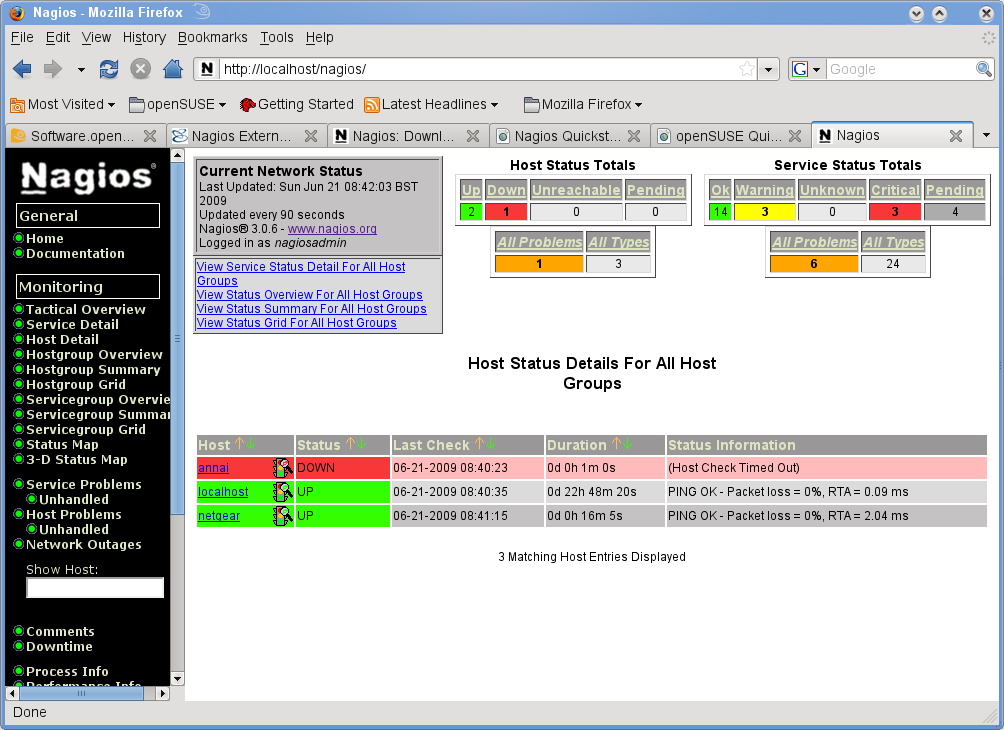


Thats the installation complete. Open a web browser and browse to http://localhost/nagios or http://
Thats it…Nagios is up and running. Now, you can add more devices like more Linux systems and servers, Windows or network appliances. Obviously,monitoring needs could change from anything being a dead or alive (ping) test to more checks like the ones we do here on the localhost.
A quick tip would be to create seperate config files for different types of devices like Windows, Linux etc or even a config file for each of the devices. This approach of config files for each device can reduce the maintenance perspective as you can pin point issues (if any) down to the particular file for the particular device also, any changes we know is for sure going to be only on the relevant file. The downside would be maintaing the files themselves.
Also, for each of these config files. there needs to be an entry in the /etc/nagios/nagios.cfg file. For instance, the localhost config file is entered as
cfg_file=/etc/nagios/objects/localhost.cfg
Else the cfg file will be completely ignored. Also, a good practice would be to verifiy the config changes (including adding or deleteing new devices) as failing to do so can bring down Nagios completely. To verify simply run nagios with “-v” switch and the config file as follows:
opensuse11:~ # nagios -v /etc/nagios/nagios.cfg
This should report any errors. When all looks good, restart nagios as follows
opensuse11:~ # rcnagios nagios restart
For more configuration details, click here to view Nagios Documentation
Related posts
1-click installs for Nagios Addons & plugins in openSUSE 11.0 (3)
AbiWord – Free opensource Word Processor for openSUSE Linux (2)
Acetoneiso2 – A full feature rich Image/ISO tool for openSUSE (6)
This entry was posted on Sunday, June 21st, 2009 at 10:26 pm and is filed under Monitoring. You can follow any responses to this entry through the RSS 2.0 feed. You can leave a response, or trackback from your own site.
<!--
google_ad_client = "pub-9633753545729491";
/* SuseGeek-Post-Bottom */
google_ad_slot = "3249034109";
google_ad_width = 336;
google_ad_height = 280;
//-->
Subscribe to:
Posts (Atom)